
In LinkWare Stats, you will see a graph similar to that below:
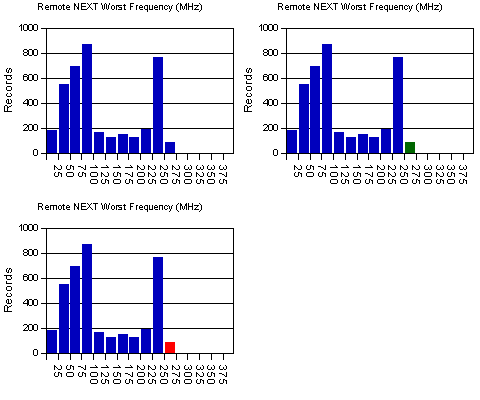
What may seem strange at first, are the results from 250 MHz to 275 MHz. How can this be given the limit line stops at 250 MHz? The lesser side of the bar is inclusive, so this bar would be
250.0 <= x < 275.0
In other words, these are records at 250 MHz exactly, no other frequency. If it wasn’t done that way, a negative margin bar from -1 to 0 would include a 0.0 data point; which would be annoying.